Unit 3: The AS/AD models
- The equilibrium of AS &AD determines current output (GDPr) and the price level
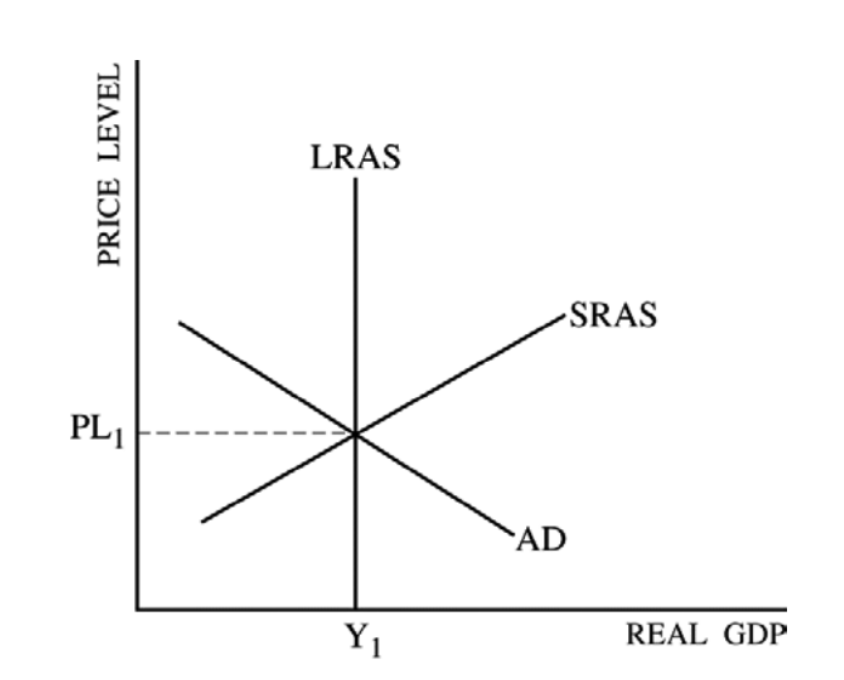
Full employment - equilibrium exists where AD intersects SRAS & LRAS at the same point
Recessionary Gap- a recessionary gap exists when equilibrium occurs full employment output.
Inflationary Gap- an inflationary gap exists when equilibrium occurs beyond full employment output
U% - unemployment
𝝅% - inflation
3 Ranges of AS
Keynesian of horizontal range
- Not fully using all of the resources
- Could be a recession or depression (not where need to be)
- below full employment
- Resources are getting closer to full employment, which creates upward pressure on wages and price
- Real GDP is at a level with unemployment at the full employment level where any increase in demand will result only in an increase in prices

Demand pull inflation (Always increasing )
- Increase in price level resulting from increase in total spending in the economy
- C, Ig, G, Xn causes AD to increase

Cost-Push inflation using AD-AS Diagram
Cost- push inflation occurs when firms respond to rising costs by increasing their prices to protect margins can be caused by:
- Rising unit labour costs more you have to pay in manpower
- Higher prices for important components/raw materials
- A depreciation in the exchange rate causing a rise in import costs
- An increase in business taxes e.g. VAT or environmental taxes such as a carbon tax

Some Factors Affecting Inflationary Pressures
- Rising property prices → increased consumer wealth→ demand pull inflation risk
- increasing world oil prices → Higher costs for businesses → cost- push inflation risk
- Depreciating exchange rate → increased import prices + rising exports → cost push and demand pull inflation rise
- Rapid expansion of money and credit from banks → rising consumer spending financed by loans → demand pull inflation risk

What do you think an AD/AS Graph representing the United States would look like?
ReplyDelete